Standard addition method of spectroscopy

How to Apply Standard Addition Method For Spectrometric Analysis

Facebook
Twitter
LinkedIn
WhatsApp
Pinterest
Reddit

Usage of standard addition method 

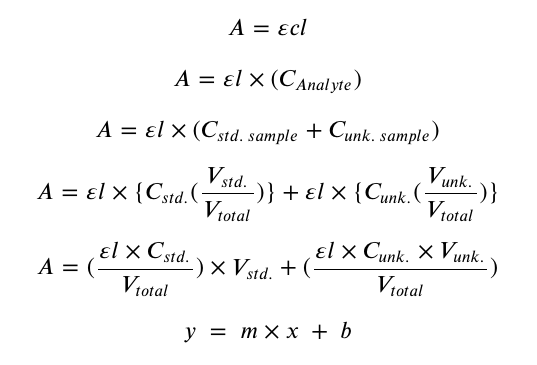
The standard addition method is often used in quantitative analytical chemistry. In this method, a standard is added directly to the aliquot of the analyte sample. The concentration of the analyte sample is kept constant throughout the process. Added standard concentration is varied to determine an unknown concentration of an analyte by using Beer-Lambert’s law.

Eppawala rock phosphate (ERP) is mined from Eppawala in Sri Lanka. In a dilute orthophosphate solution, ammonium molybdate reacts under acid conditions to form the heteropoly acid, molybdophosphoric acid. In the presence of vanadium, yellow vanadomolybdo-phosphoric acid is formed. This method is called the vanadomolybdo phosphoric acid method (VM method). The absorbance wavelength of the complex is in-between 460 – 480 nm. (Reference: Jeffrey G. H, Bassett J. Mendhan J.. Denney R. C.; “Vogel’s Textbook of Quantitative Chemical Analysis”, Fifth Edition (ELBS) Longman, pages 730, ISBN 0582251672).

Determination of the maximum wavelength (𝜆𝑚𝑎𝑥) for the citric-soluble phosphate

The graph of absorbance vs wavelength for the citric-soluble phosphate
Graph 01
λmax for the citric soluble phosphate  = 420 nm

Determination of the citric-soluble phosphate.

Trail Added volume of Ammonium vanadate (cm3) Added volume of Ammonium molybdate (cm3) Added volume of Eppawala Apatite (cm3) Added volume of Standard phosphate sol. (cm3) Absorbance at 420 nm wavelength
01 5.00 5.00 5.00 1.00 0.309
02 5.00 5.00 5.00 2.50 0.344
03 5.00 5.00 5.00 4.00 0.360
04 5.00 5.00 5.00 5.50 0.395
05 5.00 5.00 5.00 7.00 0.435
06 5.00 5.00 5.00 8.50 0.478
tutebucket spectroscopic calculation eq 01
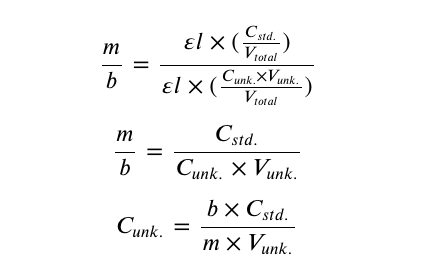
tutebucket spectroscopic calculation eq 01 def
The Graph of Absorbance at 420 nm wavelength Vs Added volume of working standard of phosphate
Graph 02
tutebucket spectroscopic calculation eq 02

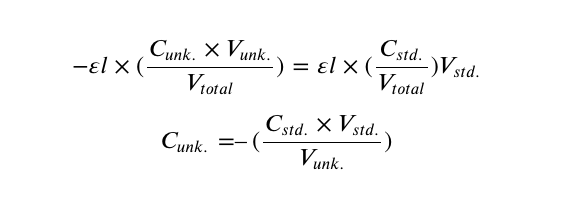
We can extrapolate the graph until y=0

The Graph of Absorbance at 420 nm wavelength Vs Added volume of working standard of phosphate 2
Graph 03

1 thought on “How to Apply Standard Addition Method For Spectrometric Analysis”

Leave a Comment

Your email address will not be published. Required fields are marked *

Subscribe To Our Weekly Newsletter

Get notified about new articles

tute bucket logo2
Privacy Overview

This website uses cookies so that we can provide you with the best user experience possible. Cookie information is stored in your browser and performs functions such as recognising you when you return to our website and helping our team to understand which sections of the website you find most interesting and useful.