How to Apply Standard Addition Method For Spectrometric Analysis
Lakshan Ranasinghe
Standard addition method of spectroscopy
Usage of standard addition method
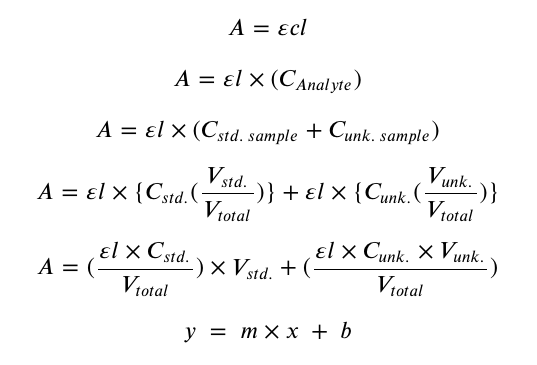
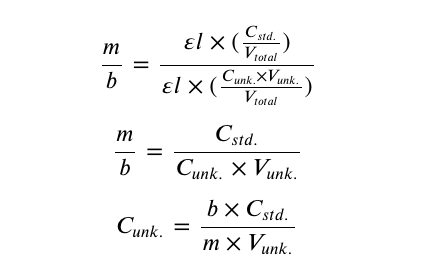
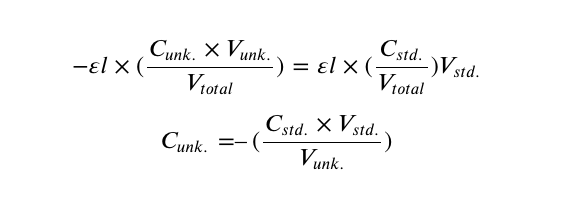
The standard addition method is often used in quantitative analytical chemistry. In this method, a standard is added directly to the aliquot of the analyte sample. The concentration of the analyte sample is kept constant throughout the process. Added standard concentration is varied to determine an unknown concentration of an analyte by using Beer-Lambert’s law.
Eppawala rock phosphate (ERP) is mined from Eppawala in Sri Lanka. In a dilute orthophosphate solution, ammonium molybdate reacts under acid conditions to form the heteropoly acid, molybdophosphoric acid. In the presence of vanadium, yellow vanadomolybdo-phosphoric acid is formed. This method is called the vanadomolybdo phosphoric acid method (VM method). The absorbance wavelength of the complex is in-between 460 – 480 nm. (Reference: Jeffrey G. H, Bassett J. Mendhan J.. Denney R. C.; “Vogel’s Textbook of Quantitative Chemical Analysis”, Fifth Edition (ELBS) Longman, pages 730, ISBN 0582251672).
Determination of the maximum wavelength (𝜆𝑚𝑎𝑥) for the citric-soluble phosphate